Archive for Uncategorized

Friday, November 11th, 2011

Visualizing the numbers

Did you know that math helped pick your clothes today? Indeed, you dressed up with math! One particular way this is true relates to the clothes you buy in a store. Your choices are constrained by the selections in the store.

Picture adapted from: http://stylizedlife.blogspot.com/2010/07/college-fashion-for-both-genders.html

To get a sense of what is “popular,” opinion groups rate products via surveys and polls. Data can yield a wealth of information. But, first, we must be able to interpret it.

Picture adapted from: http://paradelle.files.wordpress.com/2010/10/numbers.jpg

Graphs and charts are useful ways of representing many forms of data. A variety of different types of graphs appear frequently in the news.

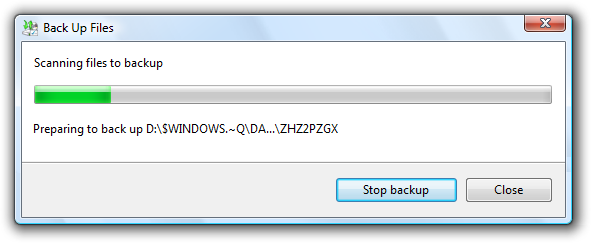
First, we’ll go to the bar. Bar charts are a very popular and common means of visualizing data. We’ve all seen a bar chart with one bar telling us the progress of a computing device.

Picture credit: http://i.msdn.microsoft.com/dynimg/IC46037.png

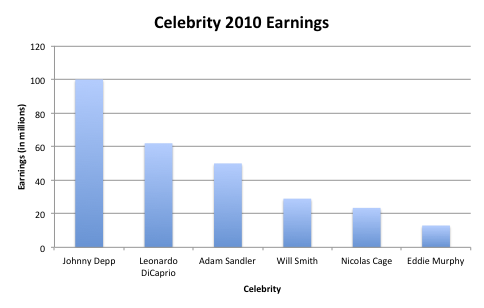
Bar charts that use multiple bars enable us to quickly sense the relative size of different quantities. For instance, consider this chart depicting celebrity earnings from 2010 taken from Hollywood’s Highest Paid Stars 2011. (Click the image if you’d like to see it larger.)

Looking at the chart above, about how much more did Johnny Depp make last year than Nicolas Cage? Even without knowing the exact amounts, you can look at the relative sizes of the bars to get a sense.

Got pie?

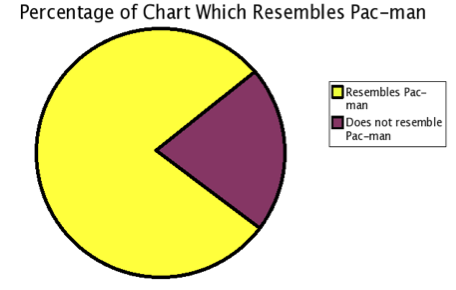
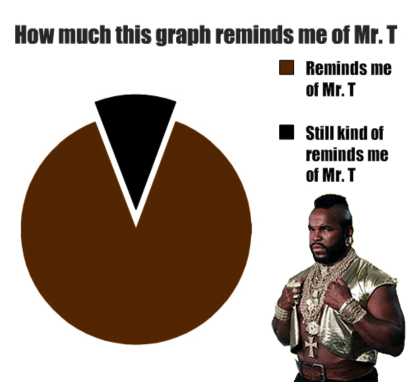
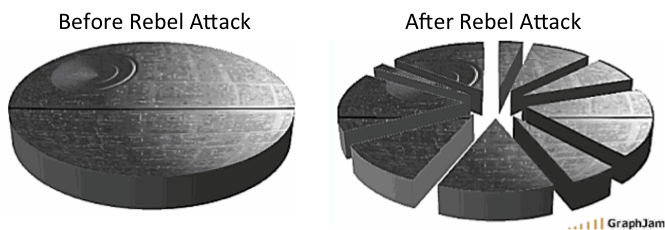
A pie chart subdivides a circle into “slices” where each sector corresponds to a category. The area of each sector is proportional to the percentage of the items in that category. Keep in mind that a chart is intended to give useful information in a visual way. Let’s see some charts that aren’t as successful at displaying helpful information.

Picture credit: http://news.discovery.com/tech/pac-man-pie-chart.html

Picture adapted from: http://www.flickr.com/photos/35201559@N02/3276736156/

Picture credit: http://zipinotes.com/wp-content/uploads/2009/03/death-star.gif

While bar and pie charts are rather standard ways to visualize data, keep in mind that many other techniques are being used and developed. For example, here is a visualization of 30 school district mission/vision statements. This is very similar to the word cloud that appears in this blog that represents the frequency of different tags I use for my blog posts.

Picture credit: http://www.peterpappas.com/2008/09/visualizing-data-and-text-a-comparison-learning-strategy-that-works.html

What’s the best way to visualize data? It largely depends on the data and what you want to emphasize about the data.


Thanks to Kristianna Luce, a fellow in the 2011 Charlotte Teachers Institute Math through Popular Culture seminar, for inspiring this blog entry with her curriculum unit ideas for high schoolers.

Friday, October 21st, 2011

Jay Leno meets Martin Gardner

It is October 21, 2011 and around the world have been, are, or soon will be Celebration of Mind events to honor Martin Gardner who was born on this day in 1914. His work and writing, which infused fun into math, touched millions of lives. The Celebration of Mind at Davidson College will be in December. To honor Martin Gardner on this day, I present a version of his delightful puzzle “The Missing Dollar from aha! Gotcha. I’ll modernize it a bit and by the end lose much more than a dollar!

Picture credit: http://www.fuzzimo.com/24-free-lp-vinyl-records-pictures-textures/

It’s autumn. Crisp air paints the landscape with fiery colors. It is time for football, soccer, and volleyball. Cub Scouts sell popcorn. Driveways become displays of household treasures in yard sales. Suppose your entire block decides to have such yard sale over two days. The participating houses fill a table with vinyl records. The first day, the more standard larger records are sold 2 for $3 and the
smaller 45 records are sold 3 for $3. You sell 30 standard records (totaling $45 income) and 30 of the smaller records (yielding $30 of income) giving a grand total of $75 in record sales. The neighbors look for more records enabling another impressive display of nostalgic turntable tunes to be available on the second day of the yard sale. However, on this day, they decide to sell the records 5 for $6. Amazingly, they sell exactly 60 records, just like the first day! They total their sales and find they made $72 this day! Where is the missing $3?

It’s only $3. Who cares? This time, suppose Jay Leno, known for his large collection of cars, buys eight Rolls Royces at a price of two for $500,000 and eight BMW convertibles at four for $340,000. Jay can close the deal with a $2,680,000 cashier’s check. Before the cars are delivered, Jay has a change of heart. If we use the reasoning from the previous problem, Jay could sell the cars at a price of six for $840,000 or $140,000 each. I’ll take six Rolls Royces, please, which costs me only $840,000 even though they are worth two million dollars according to the original sale. Ah, clever! In that case, I must buy all the cars or no deal. Suppose I do! Now, I only need to pay Jay $2,240,000 for all sixteen cars. That’s a loss of $440,000! Not funny…not funny at all!

Why? Dig around…play with the numbers…and celebrate the way Martin Gardner could captivate minds with math!

Friday, October 14th, 2011

Running the option in football

Last Sunday, the Carolina Panthers narrowly lost to the New Orleans Saints 27-30 in week 5 of the 2011 NFL season. From the score, Cam Newton appears to have led the Panthers to 3 touchdowns and 2 field goals. The score gives a sense of how the game unfolded that afternoon in Charlotte. Or does it? Take a moment and think about the numbers. The Panthers could have converted 9 field goals or could have scored 4 touchdowns and missed an extra point. In fact, the possibility of missing an extra point opens up other options such as scoring one field goal and four touchdowns without any extra points. If we consider field goals, touchdowns and touchdowns without extra points, there are 7 ways the Panthers could have reached 27 points.

There are more options! Safeties, worth 2 points, occur when the offense is tackled in their own end zone. So, 27 points could accrue from 2 touchdowns, 3 field goals and 2 safeties! Or, how about 12 safeties and a field goal? Frankly, probably not probable! In all, there are 31 different scoring combinations equalling 27 points.

What about New Orleans’ score of 30? Simply adding 3 additional points leads to 41 scoring combinations!

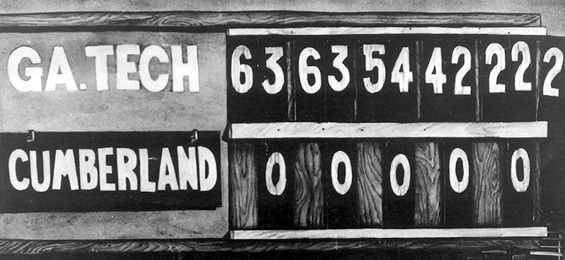
How fast does this grow? Consider the 1916 Cumberland versus Georgia Tech game. Georgia Tech won 222-0. Yes, you read that right, I meant to type two hundred twenty two! Make a guess. How many scoring combinations, however unrealistic? Remember the safeties. For instance, Georgia Tech could have scored with 111 safeties that day! In fact, there are 8,162 ways for Georgia Tech to have reached that score.

This is an overwhelming number of possibilities. Can we use available information to simplify the problem? Let’s return to the Panthers’ game. They scored 6, 7, 7, and 7 points in each of the four quarters of the game. The only way to score 7 points is a touchdown or a field goal and 2 safeties. Let’s assume more than 1 safety could be scored, which is unlikely given safeties occur about once in 20 games, according to What’s a Safety Really Worth. Even with this assumption, we significantly reduce the number of scoring options from 31 to 9.

In a similar way, let’s turn to the scoreboard of the Cumberland versus Georgia Tech game.

Recall, if we simply look at the score 222-0. The number of scoring combinations is 8,162. There are 247 ways to score 63 points. Similarly, there are 168 and 90 ways to score 54 points and 42 points, respectively. So, if we consider how many points were scored in each quarter of the game, we find there are 247 + 247 + 168 + 90 = 752 different ways for Georgia Tech to score in their game. If we assume no safeties, then there are only 80!

So, the next time you see a final score for a game, think twice about assuming what happened. If you want to know, take the option of watching the game (or if the game is over the highlights)!


Thanks to Emily Sansale, a fellow in the 2011 Charlotte Teachers Institute Math through Popular Culture seminar, for inspiring this blog entry with her curriculum unit ideas for her fifth grade classroom.

Friday, September 30th, 2011

Chocolate Chip Pi

How can a kiss help us learn Calculus? If you sit and reflect on answers to this question, you are likely to journey down a mental road different than the one we will traverse. We will indeed use a kiss to motivate a central idea of Calculus, but it will be a Hershey kiss! In fact, we will have a small kiss, more like a peck on the cheek, as we will use white and milk chocolate chips. The math lies in how we choose which type of chip to use in our computation.

Let’s start with a simple chocolatey problem that will open a door to ideas of Calculus. A Hersey’s chocolate bar, as seen below, is 2.25 by 5.5 inches. We’ll ignore the depth of the bar and consider only a 2D projection. So, the area of the bar equals the product of 2.25 and 5.5 which is 12.375 square inches.

Note that twelve smaller rectangles comprise a Hershey bar. Suppose I eat 3 of them. How much area remains? We could find the area of each small rectangle. The total height of the bar is 2.25 inches. So, one smaller rectangle has a height of 2.25/3 = 0.75 inches. Similarly, a smaller rectangle has a width of 5.5/4 = 1.375. Thus, a rectangular piece of the bar has an area of 1.03125, which enables us to calculate the remaining uneaten bar to have an area of 9(1.03125) = 9.28125 square inches.

Let’s try another approach. Remember that the total area of the bar is 12.375. Nine of the twelve rectangular pieces remain. Therefore, 9/12ths of the bar remains. I can find the remaining area simply be computing 9/12*(12.375) = 9.28125. Notice how much easier this is than the first method. We’ll use this idea to estimate the value of π with chocolate, but this time we’ll use chocolate chips!

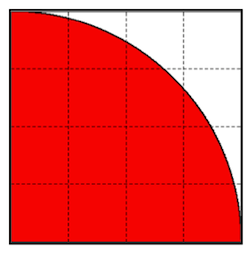
Let’s compute the area of a quarter circle of unit radius, which equals π/4 since the full circle has an area of π. Rather than find the exact area, let’s estimate. We’ll break our region into squares as seen below.

This is where the math enters. We will color the squares red or white. Let’s choose to color a square red if the upper right-hand corner of the square is in the shaded region and leave it white otherwise, which produces:

Notice, we could have made other choices. We could color a square red if the upper left-hand corner or even middle of the square is under the curve. Some choices will lead to more accurate estimates than others for a given curve. What choice would you make?

Again, the quarter circle had unit radius so our outer square is 1 by 1. Since eight of the 16 squares are filled, the total shaded area is 8/16.

How can such a grid of red and white squares yield an estimate of π? In the grid above, notice that 8/16 or 1/2 of the area is shaded red. This is also an approximation to the area of the quarter circle. So, 1/2 is our current approximation to π/4. So, π/4 ≈ 1/2. Solving for π we see that π ≈ 4*(1/2) = 2. Goodness, not a great estimate! Using more squares will lead to less error and a better estimate. For example, imagine using the grid below:

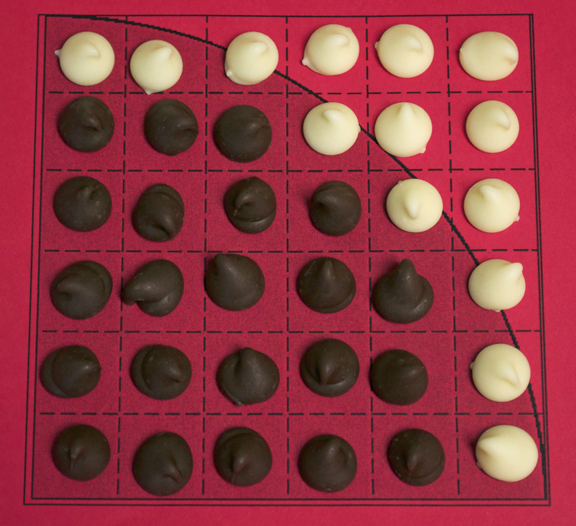
Where’s the chocolate? Rather than shading a square, we will place a milk chocolate chip on a square we would have colored red and a white chocolate chip on a region that would have been white. To begin, the six by six grid on the left becomes the chocolate chip mosaic we see on the right, which uses 14 white chocolate of the total 36 chips. So, our estimate of π is 2.4444. We are off by about 0.697.

Next, we move to an 11 by 11 grid of chocolate chips. If you count carefully, we use 83 milk chocolate chips of the 121 total. This gives us an estimate of 2.7438 for π, which correlates to an error of about 0.378.

Finally, with the help of public school teachers in my seminar Math through Popular Culture for the Charlotte Teachers Institute, we placed chocolate chips on a 54 by 54 grid. In the end, we used 2232 milk chocolate chips giving an estimate of 3.0617 having an error of 0.0799.

What do you notice is happening to the error as we reduce the size of the squares? Indeed, our estimates are converging to the exact area. Here lies a fundamental concept of Calculus. If we were able to construct such chocolate chip mosaics with grids of ever increasing size, then we would converge to the exact area. Said another way, as the area of the squares approaches zero, the limit of our estimates will converge to π. Keep in mind, we would need an infinite number of chocolate chips to estimate π exactly, which is a very irrational thing to do!

And finally, here is our group from the CTI seminar along with Austin Totty, a senior math major at Davidson College who helped present these ideas and lead the activity, with our chocolatey estimate for π.

Wednesday, August 24th, 2011

Icing (and some M&Ms) on the cake

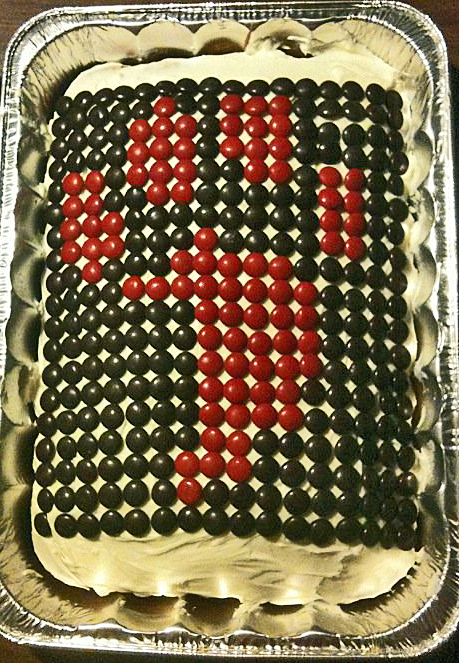
Today is the Freshmen Cake Race at Davidson College. A few hundred cakes are baked by members of the town and brought to the college before the afternoon run.  The tradition began with the incoming class of ‘34 and their running a mandatory 1.7 mile race. Since then, it has been “On your mark…get set…go for Cake” for every class except once during WWII and once in the early 70’s.  The race was established by Davidson track coach Pete Whittle with the goal of uncovering hidden talent in the incoming freshmen class and asking them to come out for the track team. The cake was the incentive for a good race!

Davidson College spirit mark

My family has baked at least one cake every year.  This year, we decided to combine math with culinary art.  We wanted to decorate the cake with the spirit mark of the paw print. Rather than replicating the piece in icing, we decided to lean on my math and created an M&M mosaic with a computer program I wrote in Matlab for an upcoming book. With a few artistic alterations to the coloring, we created the cake (and another using M&Ms and white chocolate chips) for a freshmen who will finish the race…it will be a piece of cake! Upperclass students often stalk the freshmen. The eating of the cakes becomes a wonderful time of fellowship and community. Maybe a math or computer science student, who has taken a class where I discussed the math behind a mosaic, will share this cake and explain the math.

Thursday, August 11th, 2011

Having a ball with math

In my mime and math show, I usually teach simple mime illusions like touching an invisible wall and catching a mime ball. The illusions are then connected to mathematical concepts. How? Watch the following video and follow along, if you will.

For children, this exercise touches on useful concepts of arithmetic and estimation. Further, they explore the concept while learning a mime illusion that many practice in line as they leave a school assembly to return to their classrooms. It is also an active, kinesthetic way of exploring such ideas. And, no one gets hit in the head with the ball!  I’ll leave you with a picture of a group of children making their mime ball.

Tuesday, August 9th, 2011

Presenting math

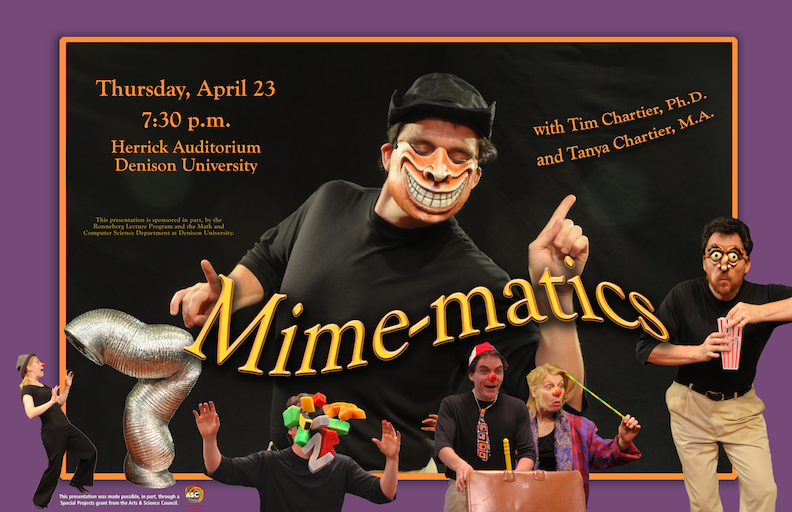
Recently, I have been asked a number of times for a list of talks that I present on mathematics. While the list will grow, as I’m even creating a new talk next week for a conference on integrating social issues into the curriculum, this can give a reader a sense of topics I present. For the graphic associated with a talk, click the image to see it enlarged.


Title: Mime-matics

Abstract: In Mime-matics, Tim Chartier explores mathematical ideas through the art of mime. Whether creating an illusion of an invisible wall, wearing a mask covered with geometric shapes or pulling on an invisible rope, Dr. Chartier delves into mathematical concepts such as estimation, tiling, and infinity. Through Mime-matics, audiences encounter math through the entertaining style of a performing artist who have performed at local, national and international settings.

Comment: This presentation is for general audiences and has several forms. For instance, the abstract above is for the solo show and the poster to the left includes Tanya Chartier. The presentation has been performed for lower elementary through college and retirement homes. It is often performed at colleges for students, faculty and the surrounding community.


Title: Putting a Spring in Yoda’s Step

Abstract:

When the character Yoda first appeared on the silver screen, his movements were due to the efforts of famed muppeteer Frank Oz. In Star Wars Episode II: Attack of the Clones, Yoda returned to the movies but this time the character was not a puppet but a digital image within a computer. This talk will discuss the role, or more aptly the force, of mathematics behind a few aspects of movie special effects. Armed with differential equations, animators can create a believable flow to Yoda’s robe or a convincing digital stunt person.

Comment: This talk requires permission from LucasFilms as I use images and video from them.


Title: A pretty mathematical face

Abstract: Have you ever wondered what celebrities you look like? This talk develops a mathematical answer to this question from a group of celebrity photos. Vectors norms enable us to discern what celebrity looks most like a selected individual. Then, we broaden the question to explore what linear combination of celebrity photos best approximates a selected photo. Would you describe yourself as a cross between Russell Crowe and Ben Stiller? or maybe Julia Roberts and Jennifer Aniston? In this talk, we learn how to answer this question using mathematical methods from undergraduate linear algebra classes.

Comment: This talk has been given at a math banquet and math seminars. The banquet was attended by math majors and their families. It starts simply and builds to a bit more complicated levels but is generally enjoyable to all.


Title: March Mathness

Abstract: Every year, people across the United States predict how the field of 65 teams will play in the Division I NCAA Men’s Basketball Tournament by filling out a tournament bracket for the postseason play. This talk discusses two popular rating methods that are also used by the Bowl Championship Series, the organization that determines which college football teams are invited to which bowl games. The two methods are the Colley Method and the Massey Method, each of which computes a ranking by solving a system of linear equations. We also touch on how to adapt the methods to take late season momentum into account. We also see how the methods did in creating mathematically-produced brackets for 2010 March Madness.

Comment: This talk teaches the ideas behind the mathematical brackets that my research team creates and in 2010 and 2011 my students in a math modeling class also created. In 2011-2012, I hope to integrate such ideas into a finite math class.


Title: Thinking linearly about data

Abstract: From sports to social networks to movie ratings, data sets ever increase in size and availability. Mining such masses of information for meaning is common and an active area of research in science and business. This talk will discuss techniques in ranking and clustering that rely on linear algebra. Recent work will be discussed as well as how to present such work at the undergraduate level for research and in classes for math majors and nonmajors.


Title: Entertaining Math: juggling, magic and circus tricks

Abstract:

Love math but felt ever stuck on how to get someone else excited? How about juggling, presenting a magic trick, or performing a circus trick like balancing an object on your hand to teach or motivate a mathematical idea? In this presentation, we will explore ways to demonstrate and discuss mathematics using techniques generally associated with entertainment and the performing arts. Come ready to learn a few tricks and possibly some new math!


Title: Sports ranking – March Madness to Twitter

Abstract: In the past decade ranking methods have been used for a variety of applications from the web to ecological systems to sports teams. This talk will discuss the Massey and Colley methods, which are two of the six computer ranking methods factored into NCAA College Football’s BCS rankings that are used to determine which teams are invited to play in which bowl games. Both methods compute a ranking by solving a linear system of equations and can be applied to a large variety of sports. In this talk, we will introduce the integration of nonuniform weighting for these methods. Further, we will explore challenges in using PageRank, the very successful method of Google for ranking webpages. We will discuss how such methods can produce brackets for the Division I NCAA Men’s Basketball Tournament also known as March Madness. Finally, we will discuss recent work that adapts sports ranking methods to social networks such as Twitter.


Title: Googling Markov

Abstract:

You submit a query to Google and soon the search engine returns an ordered list of pages. The page listed first is considered, loosely speaking, the best web page related to your query. How is this page given such distinction? A web page, call it A, is considered more “important” than another if more web pages link to it. However, Google also considers the importance of the web pages that link to web page A. Links from pages that are themselves “important” are given more weight. In the end, web pages with a high number of weighted links are given higher ranking in terms of the importance of the page. Google uses this ranking of importance combined with text-matching algorithms each time it conducts a search. The web page that has the “best” combination of importance and relevance to a given query is the web page that tops the list returned by Google. This talk introduces the role of Markov Chains in this process.


Title: When life is linear: research in numerical linear algebra

Abstract:

Learning to solve a linear system Ax = b is a part of many undergraduates’ education. This talk will discuss research directions in linear algebra when the matrix system is solved on a computer numerically. First, researchers explore developing and improving algorithms for solving such linear systems. Complex mathematical models common in modern science lead to matrix systems containing millions or even billions of unknowns. For such problems Gaussian elimination is crippled due to its inefficiency. This talk will discuss how iterative methods attempt to solve Ax = b efficiently and quickly. Second, we will consider areas where numerical linear algebra is useful, particularly, ranking and clustering. While these techniques can be useful for a wide range of applications, we will discuss their use in sports, web search, and social networks like Twitter. Finally, this talk will mention how such research in this area can be conducted both at one’s graduate institution and in internships at government national research laboratories.


Title: Improving on your Mistakes: solving linear systems iteratively

Abstract: Learning to solve a linear system (matrix system) Ax = b using Gaussian elimination is a standard topic in a math major’s undergraduate education. Complex mathematical models common in modern science lead to linear systems containing millions or even billions of unknowns. For such systems Gaussian elimination can be crippled due to inefficiency. This talk will discuss how iterative methods attempt to solve Ax = b efficiently and quickly. The iterative process begins with an initial guess to the solution. Subsequent iterations generate successive approximations to the solution. After establishing a framework for iterative methods, I will look closely at multigrid methods, which are designed to solve linear systems resulting from partial differential equations.

Comment: This touches on my research in multigrid methods and is essentially a primer on using iterative methods and then multilevel methods to solve large linear systems.

Monday, August 8th, 2011

Secret Codes with Math

Introduction

This activity that I created with my wife, Tanya Chartier, is intended for classroom use. I have used it after performing my Mime-matics mime show that introduces mathematical ideas in classrooms. In particular, college students from Davidson College have traveled with me and led the activity following the presentation. In each case, it has been fun and successful. The picture below to the right is Rose, a math major, leading her group in developing a cheer for their army.


Activity Overview

Facilitator will…

  • Assign student roles and guide them on their parts.
  • Allot a 2 minute time-frame for the armies to determine their cheers.
  • Read or summarize narrative.
  • Play role of Acceleratus within narrative.
  • Present paper with the message to be deciphered while playing Acceleratus.

The class will play the following roles:

  • One student will be Julius Caesar and will be given the corresponding mask (found at bottom of the this post).
  • One student will be General Mathematicus Superfluus and will be given the corresponding mask (also found at the bottom of this post).
  • Half of the class will be the army of Caesar.
  • The other half will be the army of Superfluus.

Student Responsibilities:

  • Caesar and Superfluus will enact the story as it is read.
  • Both armies should propose a brief cheer for their army (2-3 words/grunts e.g. “hu-ha” or a short phrase).
  • When the words “Julius Caesar’s army” or “General Mathematicus Superfluus’ army” are read, the army will cheer their cheer.
  • Superfluus and Caesar are responsible for visually signaling the cheer for his/her army.

Narrative

We are in the Roman Empire during the reign of Emperor Julius Caesar. A battle rages between Julius Caesar’s army (pause for cheer) and General Mathematicus Superfluus’ army (pause for cheer). Each side is full of brave and valiant soldiers determined to defend homeland and kin. Their leaders are strong (pause), smart (pause), and confident (slight pause for acting).

During the battle, Caesar has immediate need for his currier, Acceleratus. So, he beckons him in a loud voice saying, “——” (facilitator pauses for Caesar to fill in the blank). Acceleratus, light of foot and quick in reflexes, darts through Julius Caesar’s army (pause for cheer). Soon, Acceleratus (played by facilitator) arrives and has a scroll placed in his hand. The young currier will follow a perilous route with the intent of taking the precious message, which contains secret information that could ensure Superfluus’ defeat, to one of Caesar’s generals. With the message in-hand, Acceleratus makes his way back through Julius Caesar’s army (pause for cheer) toward Caesar’s general.

Meanwhile, General Mathematicus Superfluus’ army (pause for cheer) continues its relentless press on Julius Caesar’s army (pause for cheer). In Julius Caesar’s army (pause for cheer) Acceleratus repeatedly asks for the location of the general who is difficult to locate given the chaos. “—-” (facilitator asks for general).

Neither army has taken the advantage but suddenly a possibly fateful turn of events occurs. A soldier in General Mathematicus Superfluus’ army (cheer) catches the currier. (facilitator pauses and waits to be caught by a student). He returns Acceleratus to General Mathematicus Superfluus. The message is opened and its contents read:

FDSWXUH WKH KLOO

Looking deep into the face of currier, Superfluus senses the importance of the note. He knows well of Caesar’s cunningness and believes that the words are somehow a code. But, how does he determine their contents? He tries threatening the currier (pause for possible threat by a creative student). The currier does not divulge the secret. He then decides to entice the currier with a wonderful prize that he might receive as a trade for the true contents of the enclosed code. Superfluus, in a very sly voice, says to the currier, “—————” (pause for student to create something). In time, Superfluus again recalls the wisdom of his foe Julius Caesar, who would never divulge the key to his code to the currier who travels with his message. And so, from General Mathematicus Superfluus’ army (cheer) are called some of the finest who are asked to look carefully at the message to see if they can decipher its hidden message (pause for Superfluus to choose a few people). They work vigorously as the battle rages on.

Transition from Narrative to Lesson

Using the Secret Decoder Ring

The message found during the battle we just enacted was encoded with the Caesar cipher which encoded messages for Julius Caesar and as such bears his name. Let’s learn how to use the cipher and soon decode the message. The key is the decoder ring that we see below.

This cipher is also called the shift cipher since each letter is replaced by a letter some fixed number of positions further down the alphabet. Let’s look at examples of encoding and decoding using our secret decoder ring.

Encoding: (Putting Words into Secret Code)

Let’s encode the letter “G” using a shift of 8. Put your finger over the letter “G” and count 8 letters around the circle which will place your finger on letter “O”. Therefore, the letter “G” becomes, or is encoded as, the letter “O”.

Let’s also encode the letter “X” with a shift of 8. Again, put your finger on the letter “X” and count clock-wise around the circle 8 letters. Your finger should land on the letter “F”.

Encoding a word is the same process but simply takes a bit longer. Let’s use a shift of 5. Then the word:

MATH

becomes

RFYM.

Decoding: (Putting Secret Codes into Words)

Given the amount of the shift, called the key, we simply count counter-clockwise around the circle. For example, let’s decode the letter “D” with a shift of 9. Put your finger on the letter “D” and count 9 letters counter-clockwise. Your finger should land on the letter “U”.

Using a shift of 7, then the letters:

KLJVKL

decode to be the word:

DECODE.

We are now ready to decode the message taken from Caesar’s currier. Suppose, I slip and tell you the key is 3. Now determine the secret message and what strategy might unfold for the armies!

Below, you see the images of Caesar and Superfluus.

Saturday, August 6th, 2011

Seeing mathematical leftovers

Mime visualizes an invisible world. Generally, we expect such silent performers to press against an invisible wall or be lifted by an imaginary balloon. While such ideas can be adapted to teach mathematical ideas, the silence of a mime can also welcome an audience to make connections of their own. The whimsy of a clown can warmly welcome insights both mathematical and otherwise. Below, we see a sketch in which our only introduction is “What is it like to be the remainder? This sketch explores such a question.” What ideas do you have as you watch?

In the sketch, the clown, almost compulsively, divides objects into two groups as they emerge from his suitcase. After one show, a child from a third and fourth grade classroom wrote in a letter,

Thank you for coming to my class to teach and show us some pantomime….I especially loved the remainder act because it made me laugh. I DID see the remainder.

Did you see other ideas visualized? What ideas? Some children comment on odd and even numbers. Note that in the sketch, the clown is dividing, 1, 2, 3, 4, 7, 8, and 13 plungers into two groups. Suppose, instead, he had removed 2, 3, 5, 7, 11, and 13 plungers. How many times could he have formed 2 groups, 3 groups, 6 groups? How might you explore such questions with children, youth or college students?

In class, Marcel Marceau often said,

Mime makes the invisible visible.

What mathematical ideas can this or an adaptation of this idea visualize that interest you? Think about it! I’d love to hear your ideas.

Monday, July 18th, 2011

Silently to infinity and beyond

Mime, at least in the tradition of the great Marcel Marceau, is inherently artistic and precise in its physical articulation. Does such a limited overview of mime already set it apart from the logical field of mathematics? I don’t believe so. Mathematicians can be silenced by an elegant proof, which we may describe as beautiful. Further, mathematics does not necessarily rely on words to convey its truths. Simply consider the Proofs without Words books of Roger B. Nelsen (Lewis and Clark College).

Tim Chartier cuts an infinite rope

The ability to discuss math without words is an important nonempty overlap between mime and math. To further emphasize this idea, I first lean on the words of a master of mime with whom I trained. Marcel Marceau would often say, when not onstage of course:

“Mime makes the invisible visible.”

Such a simple concept serves as a guiding principle of pantomime which lives in imaginary worlds created by the movement artist. Audiences, in their genius as he talked about it, could enter and see great truths about themselves and humanity.

Regarding the power of seeing the invisible in mathematics, Keith Devlin states it quite well in his book The Language of Mathematics; he writes:

“Mathematics is the science of patterns, and those patterns can be found anywhere you care to look for them, in the physical universe, in the living world, or even in our own minds…mathematics serves us by making the invisible visible.”

Devlin’s text echos Marcel Marceau’s spoken words regarding the power of mime to make the invisible visible. At least conceptually, mime and mathematics can converge or at least momentarily intersect.

Mathematics lives largely in an unseen world. Mathematicians see the relationships of such entities without physical interaction. Leaning again on Devlin’s words but this time from The Math Gene, we read:

“The difference is that, in mathematics, the off-line thought is focused on objects that are themselves pure abstractions, whereas in everyday life our thoughts generally focus on real objects or fictional versions of real objects…”

Devlin argues that mathematicians see math as stories in which the characters (mathematical entities) interact through mathematical operations or relationships. Mime also leans heavily on people’s abilities to visualize the invisible. In this way, mime can contextualize mathematical ideas and enable an audience to place an abstract concept into a story.

Given my training in mime, I like to introduce mathematical ideas through mime. In time, I hope to post a variety of my sketches. For now, let’s investigate infinity, a profound concept. As you watch the video, see if you can uncover ideas of the infinite through this silent sketch about a rope that goes on forever in both directions.


Mime-matics – the infinite rope from Tim Chartier on Vimeo.