Friday, March 4th, 2011

Riemann sum&ms

Did you know that M&Ms can be integral to a Calculus lesson? Be forewarned that you may have a decision to make. Using only pictures, like in this blog entry, you can take more of a theoretical chocolate analysis of Calculus. Or, buy a big bag of M&Ms and dig in, for hands-on learning, of course.

Professor RieMMann built at: http://www.mms.com/us/becomeanmm/create/

A Riemann sum is a method for approximating the total area underneath a curve on a graph, otherwise known as an integral. The method was named after German mathematician Bernhard Riemann. The algorithm can be seen as nailing a row of planks side by side to cover the space under some curve. The thinner you make the planks, the closer they will be to covering only the area under the curve. Helpful analogy? Probably, especially if you jazz it up with a story of what might be behind the wall you’re building!

Let’s change gears though and build a mosaic with M&Ms. We’ll motivate integration with an M&M mosaic using the techniques of Professor RieMMann and find the area under the curve y = sin(x) and over the interval from 0 to π on the x-axis. We will use the graph below:

The x-axis on this graph is over the interval from 0 to π. The y-axis is over the interval from 0 to 1. Therefore, the total area of the graph is π.

Now, we cover the graph with n by 3n non-overlapping squares. For each square, we determine if there are more black pixels or white pixels. If more pixels are black, then we place a green M&M in the square, else, we place a yellow M&M in the square. Suppose we begin with 5 by 15 squares. Then, we get the M&M mosaic seen below.

This picture has 50 green M&Ms out of 75 total M&Ms. How do we use this to find the area of y = sin(x)? In the mosaic, 50/75ths of the squares are filled with green M&Ms. Using ratios, (area under curve)/π ≈ 50/75 which means our approximation to the area is:

 displaystyle {rm area~under~curve} approx pi left(frac{{rm green~M&Ms}}{{rm total~M&Ms}}right).

So, our first M&M mosaic estimates the area under the curve y = sin(x) and over the x-axis as 2.0944.

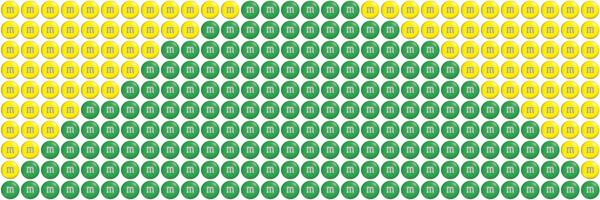
Now, let’s be more refined and use 10 rows and 30 columns of M&Ms as seen below. Here 194 out of 300 M&Ms are green. This leads to an estimate of 2.0316.
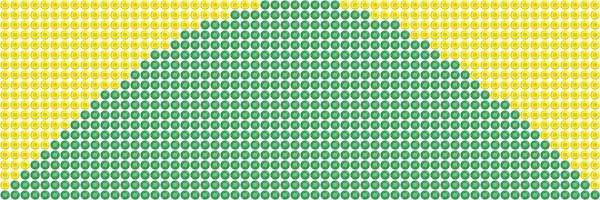
Finally, let’s create an M&M mosaic with 20 rows and 60 columns of candies. How do we do? Out of 1200 M&Ms, 771 are green, giving us an estimated area of 2.0185.
The exact area under the curve and above the x-axis is 2, which can be found using a tool of Calculus called the integral. This would be expressed as

 int_0^pi sin(x)~dx.

Can we use our technique with M&Ms to find such an area? If Professor RieMMann leans on the idea of Riemann, Newton and Leibniz, then we want to use M&Ms of decreasing radius. If we do, then as the radius of the M&Ms goes to zero, the estimated area will converge to the actual area under the curve. There is another outlook on the method. You keep enlarging the image and use normal M&Ms to create the mosaic. Then, as the number of total M&Ms goes to infinity, your estimated area will again converge to the area under the curve! Yum!!!! Fattening, but, of course, it is all in the name of Calculus!!!!

Tuesday, March 1st, 2011

Celebrity Networking

An active area of my recent research has been applying ranking methods to social networks. A popular one that has publicly available network information is Twitter. For the non-tweeter, here is a Twitter tutorial in a few sentences. Twitter is a social networking service. Users tweet by sending a text-based post of up to 140 characters. Users of Twitter subscribe to other author’s tweets, by following, which directs future tweets from that author onto the user’s Twitter website or a compatible external application (like a smartphone). Wikipedia reports that Twitter has more than 100 million users worldwide.

The Twitter API allows requests for information about users of Twitter. In this blog entry, we’ll grab information about a group of users and determine who is following whom. In particular, we’ll consider the following Twitter users who you will recognize given their celebrity:

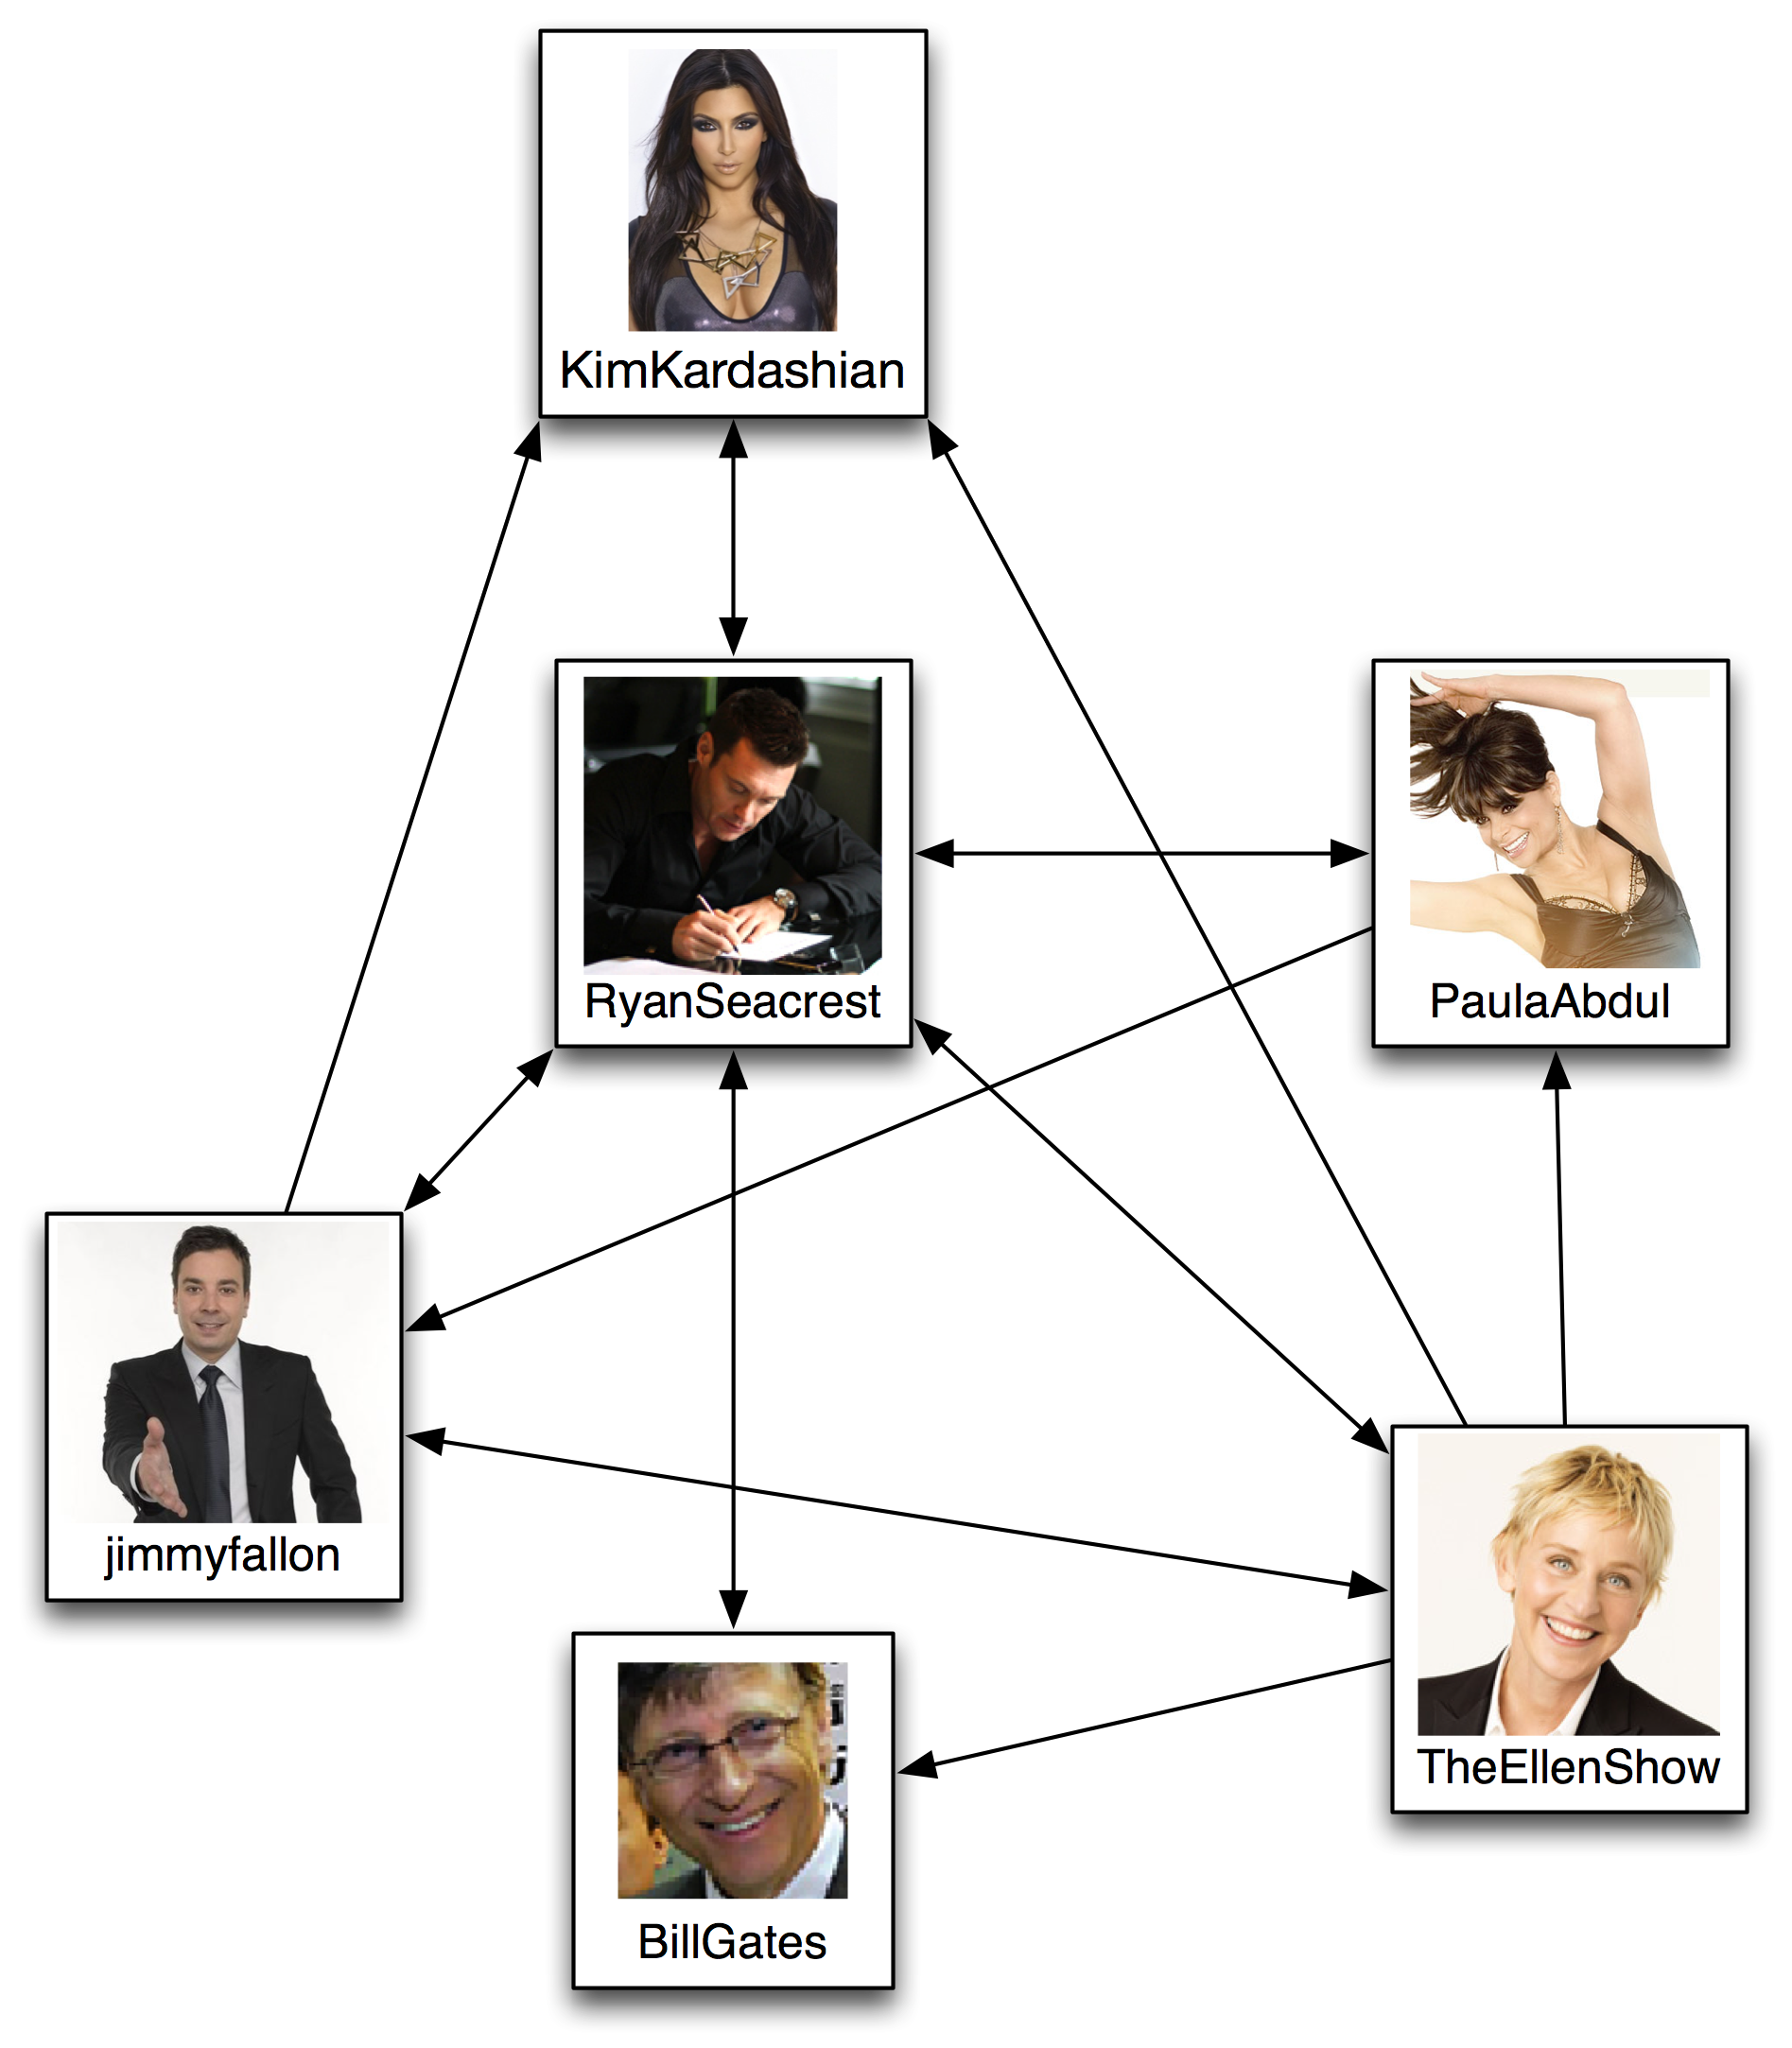
(Click the graphic to enlarge.) The names are listed in terms of the celebrity’s screen name, which can direct you to the associated Twitter webpage. For example, if you want to view Bill Gates’ page visit http://www.twitter.com/billgates. Note that you don’t need a Twitter account to view this webpage.

Now, we will use the Twitter API to determine which of these celebrities are following each other. We’ll represent this as a digraph. Each celebrity user will be a vertex. An edge will go from celebrity A to celebrity B if A follows B. The Matlab code we will use will create an adjacency matrix for such a graph. In the matrix G, the ij element of the matrix equals 1 if there is an edge from vertex i to vertex j and 0 otherwise.

How do we create such an adjacency matrix? I wrote the following Matlab code to do just such a thing.

%% twitterMatrix creates the adjacency matrix of a network of users
% on Twitter.
% Author: Tim Chartier, Davidson College
% Date: February 28, 2011

%% Input the screen names of the users you wish to form adjancey matrix of.
screenName = {‘billgates’,’jimmyfallon’,’kimkardashian’,…
‘paulaabdul’,’ryanseacrest’,’theellenshow’};

%% Use the Twitter API to grab the user IDs for the inputted screen names

ids = zeros(length(screenName),1);
numberUsers = length(screenName);

for i=1:numberUsers
url2visit = strcat(‘http://api.twitter.com/1/users/show.json?screen_name=’,char(screenName(i)));

urlString = urlread(url2visit);

indicesInString = strfind(urlString,'”id”:’);
idString = strtok(urlString(indicesInString(end)+5:end),’,’);

ids(i) = str2num(idString);
end

%% Construct Twitter adjacency matrix, T
T = zeros(numberUsers,numberUsers);
for i=1:numberUsers
friendsString = urlread(strcat(‘http://api.twitter.com/1/friends/ids.json?user_id=’,num2str(ids(i))));
eval(strcat(‘F = ‘, friendsString,’;’));
for j=1:numberUsers
if (length(find(F == ids(j))) > 0)
T(i,j) = 1; % user i follows user j
else
T(i,j) = 0; % user i does not follow user j
end
end
end

fprintf(‘Adjacency matrixn’);
T

Using this code, I found (remember this is pulling real-time data from Twitter) the following adjacency matrix:

 T = left( begin{array}{cccccc}         0 &        0 &        0 &        0 &        1 &        0 \         0 &        0 &        1 &        0 &        1 &        1 \         0 &        0 &        0 &        0 &        1 &        0 \         0 &        1 &        0 &        0 &        1 &        0 \         1 &        1 &        1 &        1 &        0 &        1 \         1 &        1 &        1 &        1 &        1 &        0 \ end{array}right),
where the first through sixth rows of the matrix correspond to the users billgates, jimmyfallon, kimkardashian, paulaabdul, ryanseacrest, and theellenshow, respectively. Therefore, we see from row 1 that billgates follows only ryanseacrest. Transforming this matrix, we have the following graph:

Note that the Matlab code given above allows you to input screen names of your choice. Some users follow so many users that it leads to a runtime error. For instance, BarackObama follows over 700,000 users. This causes an error. However, theEllenShow follows over 43,000 which does not cause an error. This code is not error-free. It was created within the last week for my students. Several friends have expressed interest so I’m blogging simply as a way of sharing the resource.

What can you do now? You can really ask a variety of questions that we ask about webpages or graphs. What is the shortest path from one user to another? This would give the minimum number of retweets within this small network of users needed for information to travel between those 2 users. How about finding the PageRank of the users? Each screen name represents a Twitter webpage which does contain a link to the other user’s Twitter webpage. Here is additional Matlab code for this:

%% Find PageRank of network by finding dominant evec

n = length(T);
G = T’;

p = 0.85;

M = (1-p)/n*ones(n,n);

for i = 1:n;
colSum = sum(G(:,i));
if (colSum ~= 0)
M(:,i) = p*(1/colSum*G(:,i))+(1-p)/n*ones(n,1);
else
M(:,i) = 1/n*ones(n,1);
end
end

[V,D] = eig(M);
diagD = diag(D);
[y,i] = max(diagD);
pageRank = V(:,i);
pageRank = pageRank/sum(pageRank);

%% Give results in bar chart

bar(pageRank)
title(‘PageRank’);
axis tight

[sortedRanking, indices] = sort(pageRank,’descend’);
fprintf(‘n****************************n’)
fprintf(‘ PageRank resultsn’)
fprintf(‘****************************n’)
fprintf(‘%15s PageRankn’,’Screen Name’)
fprintf(‘—————————-n’)
for i=1:length(sortedRanking)
fprintf(‘%15s %6.4f n’,char(screenName(indices(i))),sortedRanking(i));
end
fprintf(‘nn’)

For this network, this produces the results:

Celebrity

PageRank
ryanseacrest

0.3544
jimmyfallon

0.1526
kimkardashian

0.1503
theellenshow

0.1285
paulaabdul

0.1071
billgates

0.1071

Interesting? Another question is whether such a model appropriately models a social network. It has been very successful with webpages, presumably reflecting its relative accuracy in modeling the internet. Is Twitter different? What’s your opinion? If you teach, what do your students think? In fact, you could present such a graph to students who have studied graphs and ask how their knowledge of graphs could apply and yield information related to this social network.

Enjoy the code!

Monday, February 21st, 2011

Processing a wild fireworks show

The programming language processing, is an open source programming language for people who want to create images and animations. Those with computer experience can quickly create code with captivating visual interest. Artists can write code via a frontend that simplifies many aspects of coding.

For instance, the image below is created with a for-loop by Annie Temmink, a Davidson student who studied processing last term with me in an independent study. Can you imagine how a loop could produce such an image?

Here is the corresponding code:

size(900,400);
PImage pict;//load image
pict=loadImage(“portrait11.jpg”);
for(int i=0;i< 40;i++){
image(pict,i*15,0,pict.width/3,pict.height/3);
}

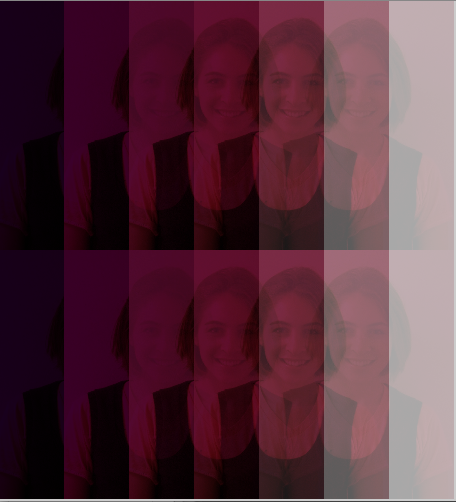
Below she experiments with the ever-important double loop.

The code that produces such an image is:

size(1000,500);
int n=4;
colorMode(RGB);
PImage pic;//load image
pic=loadImage(“portrait.jpg”);
for(int j=-1;j<2;j++){
for(int i=-1;i< 10;i++){
image(pic,i*pic.width/(n*3),j*pic.height/n,pic.width/n,pic.height/n);
tint(60+i*35,i*15,i+50+i*15,255-i*70);//change tint
}
tint(60+j*35,50+j*15,j+50+j*15,100);//brighten image
}

Processing is very close to Java and as such allows one to work with objects and OOP. A wonderful part of the community of processing coders is the large number of codes that are placed online and can be adapted for personal use. For instance, Daniel Martin, another Davidson student who graduates this May, began coding with processing quickly after Annie gave a talk on it to the Math Department. Soon, he found a fireworks class and made the following application that adapts the code. How do you make an applet? Processing allows you to easily produce a .java file, an applet, or a jar application. Click the black sky below and enjoy the show!

Interested in learning to code? Try processing! Interested in producing amazing images and interactive applications? Try processing! It is easy to learn, has an online community to help you experiment and explore. And, it’s, quite frankly, cool! Enjoy.

Monday, February 14th, 2011

Loving math

What if love songs or poems used illustrations from math? Supplying examples to demonstrate how this might (albeit with exceedingly low probability) be done could be a whimsical assignment for a Calculus class that falls nicely into a Valentine’s theme.

Here are some of my examples. I imagine students could come up with even better examples! Mine are surely nothing to alarm Hallmark! Click the image for a larger version of the illustration.


Loopy love

Twisted Lyrics
by Annie Lennox

Tell me
Darlin’
What would it take
To untie the twist in us?
Cause it’s makin’ my heart ache

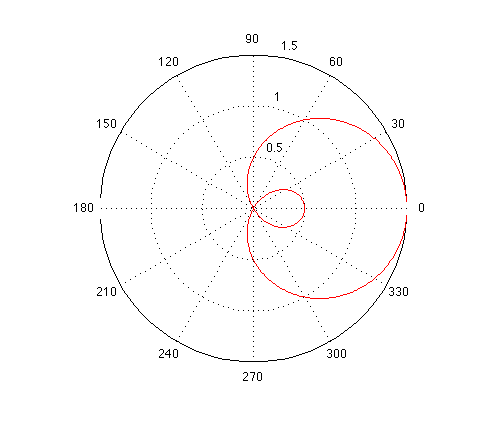
r = 0.5 + cos(t)


Love with an edge (rectangular)

Hunting High and Low
by Coldplay

There’s no end to the lengths I’ll go to
High and low
High…
Do you know how it feels to love you?
High and Low

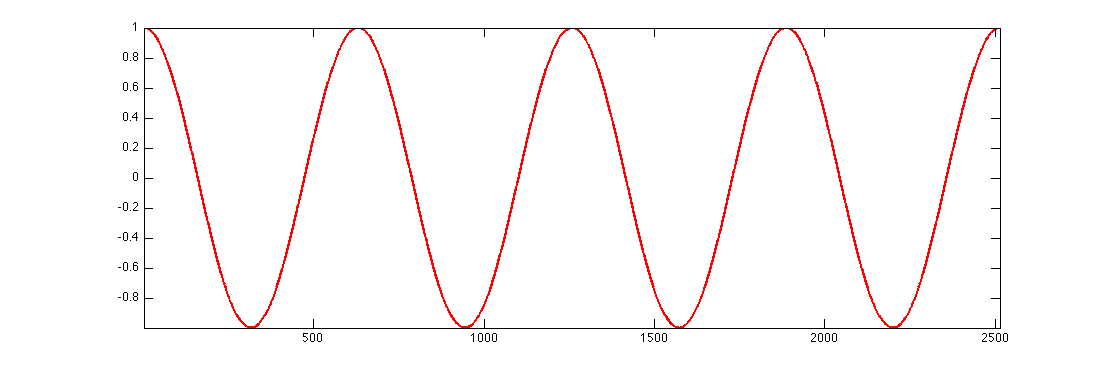
y = cos(x)


Polar love

Dying Rose
by Cleopatra

(your love is a dying rose) dying rose.
(it blooms so bright and then it goes) and then it goes.

r = sin(2t)


Happy Valentine’s Day!

Wednesday, February 2nd, 2011

X Games: X is for Math

Over the past 6 months, I’ve periodically been contacted by the ESPN program Sport Science, which airs pieces on the science behind sports, to give mathematical advice related to developing segments. This past summer and fall, I helped with pieces related to the World Cup and the Home Run Derby. Just over a week ago, I received an email from a producer of the show. Frankly, my heart rate increases simply seeing such an email in my Inbox as I know 1) the question will be challenging else their team would have answered it and 2) they will need an answer ASAP or as they often comment, “It’s TV, we needed the answer yesterday.”

Picture from www.snowboardingdays.com

Picture from www.snowboardingdays.com

The problem required predicting the velocity of a snowboarder in the X Games necessary to complete a trick called the triple cork. A model that could answer such a problem would clearly require computations from physics as a variety of variables such as friction (of the snowboard against the snow) and angular velocity (as the snowboarder spins) were inherently necessary to produce meaningful results. Knowing this, I quickly emailed Daniel Martin, who, just this December, completed his requirements for a degree at Davidson. Daniel majored in math and was all but one course short adding a double major in physics. I emailed Daniel in the evening and stated that if he was interested in collaborating, we could meet the following morning.

When I arrived the next morning, Daniel was sitting at the computer in the common space outside the offices of the Math Department faculty. He smiled and said, “I have some things for you to look at.” Daniel, overnight, had completed almost all the work. I worked through his work with him and, in a sense, became a mathematical cheerleader, of sorts, as he zipped through the computations! We discussed a few temporary hurdles that soon were overcome. As I was about to leave for a morning meeting, I said to Daniel, “I need to email ESPN. Will we have a number by noon? That would enable them to have it by 9 AM on the west coast.” Daniel replied, “Yes. I’ll have the answer is about 10 minutes. I’ll prepare a PowerPoint document to explain what I did.” I emailed the TV Producer as I headed off to my meeting.

By the time, I returned, Daniel and the TV Producer were in contact over the phone. His initial results helped the group at Sport Science think through a different way to present the conclusions. So, he needed to redo his calculations. It took part of his afternoon but soon, he had all the desired results. The TV Producer emailed to comment how helpful he had been and that the segment would air during the X Games. How exciting for us both!

This alone would have been a very satisfying story as the TV segment did appear and Daniel’s work appears throughout the piece which can be viewed below:

However, the story continues! Interestingly, Daniel and I didn’t know, in the beginning, if the wish was that our calculations would demonstrate that a triple cork was or was not possible. In fact, we both thought the point would be that such a trick was indeed not possible. However, as we looked at the emerging results, it became clear that the trick was possible. At one point Daniel even laughed, “Here we are two mathematicians sitting at a computer telling some snowboarder that he really can do it!” We both laughed and then regained focus and dug deeper into the model. What were the simplifying assumptions? Did we believe our steps? Were we making any assumptions that might result in a model that was too simplified? We walked through the results several times and in the end decided, “Yes, it does appear possible.” In the later communications with Sport Science, it became clear that the intuition of their group was that it was probably possible. I, for one, was pleased that Daniel and I didn’t enter the results hoping for such a result.

So, in the end, Daniel sent off his work to Sport Science. It was most pleasing to see the piece air during the X Games. And then, on Friday evening, Torstein Horgmo completed the first ever triple cork in competition, as predicted by Sport Science and the calculations of a talented student at Davidson College. What a wonderful moment! For me as an educator, it is a story that I will tell to underscore how mathematical models can predict behavior and how such calculations sometimes take time, unravel new questions, and are not entirely clear how to solve when you begin. You can view the moment below:

Tuesday, January 11th, 2011

Flipping over Harry Potter

Scientists, engineers and mathematicians often model events in the world with linear systems. Given the bumps, curves and sudden unexpected happenings of life, it can surprise me that such models produce meaningful results. Granted, small time steps may be required as such linearity may sufficiently hold only within a small local neighborhood, but still, life, at least mine, can feel quite far from linear!

I believe this will be my last blog post that uses linear algebra to manipulate a Harry Potter image. We’ll imagine we are in a classroom of Hogwarts learning to cast the levicorpus spell, which flips a person on the spot. Why flip Harry? Maybe Malfoy intentionally misdirected his spell from the feather on his desk to his young adversary or Ron’s wand malfunctioned or maybe….Whatever the case, Harry will flip out over the magic of linear algebra, a Muggles way of performing such a feat.

An image can be viewed as a matrix of colors. The image above that we will manipulate is 188 by 301 pixels. Each entry of the matrix stores a color of the corresponding pixel. This assumes that color is stored as a single value. Often, a color pixel is stored as a triplet indicating the amount of red, blue and green that combine to produce the color. When stored in this way, we have an n by m by 3 matrix, where the resulting image is n by m pixels. The linear algebra discussed below holds for such matrices as we could treat an n by m by 3 matrix as three n by m matrices.

To begin, let’s flip Harry in what would be a truly magical and possibly somewhat painful way that is reminiscent of a PowerPoint slide transition. To begin, we’ll swap the image’s first and last rows. Then, the second and second to last rows are interchanged. We continue to flip the image by swapping rows i and n-i+1 where n is the number of rows in the image. Below, we see how such operations would be performed on a 5 by 4 image.

After each swap, we redraw the image. The result is the levicorpus spell performed on Harry’s image as seen below.

What a painful hex! Does it look linear? It is from the standpoint of matrix multiplication. Let H equal the matrix of pixel colors for Harry’s image. Interchanging two rows is commonly used in linear algebra. To perform this as a linear operation, we take the identity matrix, which is a matrix containing zeros for all off diagonal elements and ones along the diagonal. If we want to swap rows i and j in matrix H, we form the matrix P that equals the identity matrix except we swapped rows i and j. We see such an example below if we wanted to swap the first and last rows.

The image with the rows swapped equals PH. Magic? Maybe not…but a PowerPoint transition approach to levicorpus, indeed.

Spinning Harry might be a more expected method of flipping. This can also be accomplished with matrix multiplication. This time, we form a rotation matrix,
 R = left( begin{array}{cc} costheta & - sintheta \ sintheta & costheta end{array}right)
which will rotate a vector v counterclockwise by the angle theta about the origin. However, what are the coordinates of the original pixels? If they are integral then the rotated coordinates may not also be integral. (In fact, even if they are not taken to be integral, similar issues arise.) One way to deal with this is to use interpolation to compute the pixel color of each pixel at an integral coordinate. This type of approach was used to produce the rotation below.

Enjoy using linear algebra to cast a Muggle’s levicorpus spell.

Tuesday, December 14th, 2010

A bedazzling hexing combination

Let’s continue to explore the use of linear algebra by placing a bedazzling hex on Harry Potter which will make his appearance look the exact same as the image behind him. Harry could, of course, stand behind his invisibility cloak but we’ll assume he’s misplaced it as the word hex conveniently rhymes with convex, which will be an important mathematical tool!

We’ll have Harry stand in the hall of Hogwarts seen below.

The image can be found at Wired.com. To place Harry in the scene, we grab an image of the young wizard, like the one below that can be found at http://www.bbc.co.uk/blogs/ni/Harry-Potter.jpg.

With a wave of the magic wand of Photoshop, Harry teleports from the gray background into the hall of Hogwarts as seen below.

How do we place the bedazzling hex on Harry? A little bit at a time, which can be quite vexing…convexing, actually! Let X be the matrix containing the pixel information for the image of Hogwarts with Harry. Let Y be the matrix containing the colors where Harry is not in the image.

We then progressively calculate a new matrix N = alpha Y + (1 - alpha)X
where  0 le alpha le 1. We begin with alpha = 0 in which case N = X. Incrementally, the amount of pixel information from X is decreased as the amount of Y is increased until at the end alpha = 1 and N = Y.

Can you verify that any pixel in X that is not part of Harry’s image that disappears to create Y will stay the same for any new picture we calculate? Keep in mind that this is called a convex combination since the coefficients in our linear combination are non-negative and sum to 1.

If we place all the images into a movie, we see Harry disappear before our eyes!

Would you like Harry to return? Create new images where alpha starts at 1 and decreases incrementally to 0. Then the hex will be removed through the convex combination!

Sunday, November 21st, 2010

Transitions down Diagon Alley

In this entry, the power of matrix operations will transform a youthful Harry Potter to the mature young man seen in the film released just days ago. To begin, we need Harry to enter the matrix, by storing color information of an image in an n by m matrix where the image is comprised n by m pixels. For example, the image as seen to the right is 187 by 300 pixels.

Having the image stored as a matrix allows us to use ideas from linear algebra. We will work with entries on the main diagonal of a matrix. If we have a 6 by 6 image, then the main diagonal is easy enough to find as seen in the image below.

We will also work with the k-th diagonal below (or above) the main diagonal, where 0 would be the main diagonal. For instance, the image below has orange entries for all matrix elements on the 1-st, 2-nd, 3-rd, 4-th and 5-th diagonals below the main diagonal.

We can also generalize this idea to rectangular matrices, where the number of rows and columns differ. For instance, the image below again has orange entries for all matrix elements on or below the 1-st diagonal below the main diagonal.

We now take the matrix of Harry’s image given at the start of this article and successively change the entries along the k-th diagonal. What are the values of the new diagonal? Watch the image and see Harry’s image transition by moving down Diagon Alley.

Thursday, November 11th, 2010

A Magical Cent

On October 21, 2010, over 60 sites around the world celebrated the life of Martin Gardner. Davidson College was among the locations. Our time together was filled with fun, math, and laughter – a fitting evening in honor of an influential man. While having no formal education in mathematics, Martin Gardner had an enormous influence on the subject, reflected in the words of mathematician Richard K. Guy that Gardner brought “more mathematics, to more millions, than anyone else.” While Martin Gardner created a plethora of playful mathematical enticements, let’s experience some math magic! This trick is taken from Gardner’s 1956 book Mathematics, Magic and Mystery (p. 59-60).

The trick begins after placing a group of pennies in the configuration of the number 9, as seen below.

Now simply follow the steps below:

  1. Pick a double digit number less than 20. (The trick works with any double digit number, actually, but for now let’s pick one less than 20.)
  2. Starting at the tail of the 9, count up and around the nine counter-clockwise until you reach your number. When you reach your number, click that last penny that you counted. (This should leave pennies that lie in a circle.)
  3. Beginning at that last coin touched and counting it as 1, continue to count clockwise around the circle until you again reach your selected number. Keep this penny in mind as you again click the image of the 9.
  4. Did the magic of Gardner predict your penny?

How did it work? Click through the images a few more times and see if you can uncover the mathematical magic! It’s magic so I won’t tell you the secret but the magic is quite a tail! (Pun is entirely intended.)

Thursday, October 21st, 2010

Word Sums

Today, Celebration of Mind events are being held worldwide to mark what would have been Martin Gardner’s 96th birthday, including an event at Davidson College. Gardner’s wide-reaching career spanned 80 years. He loved puzzles, illusions, and paradoxes. It’s been said that he brought “more mathematics, to more millions, than anyone else,” and also that he “turned thousands of children into mathematicians, and thousands of mathematicians into children.” Turn on your childish enthusiasm and look up some puzzles today or try this one, which while not a Gardner puzzle, definitely shows his influence!

In the sum below, the words stand for numbers. Each of the letters F, O, U, R, N, E, I, V stands for one of the digits 0-9. Different letters stand for different digits. The first digit of a number is never zero. (So, F and O cannot be zero. Can you replace the letters by numbers to get a correct sum?

Try it again tomorrow and you may get a different answer. The puzzle has 528 different solutions. Now try the following puzzle. How many of its eight different solutions can you find?

These puzzles appeared in Mathematical Puzzling by A. Gardiner, published in 1987.

« Previous Page — Next Page »